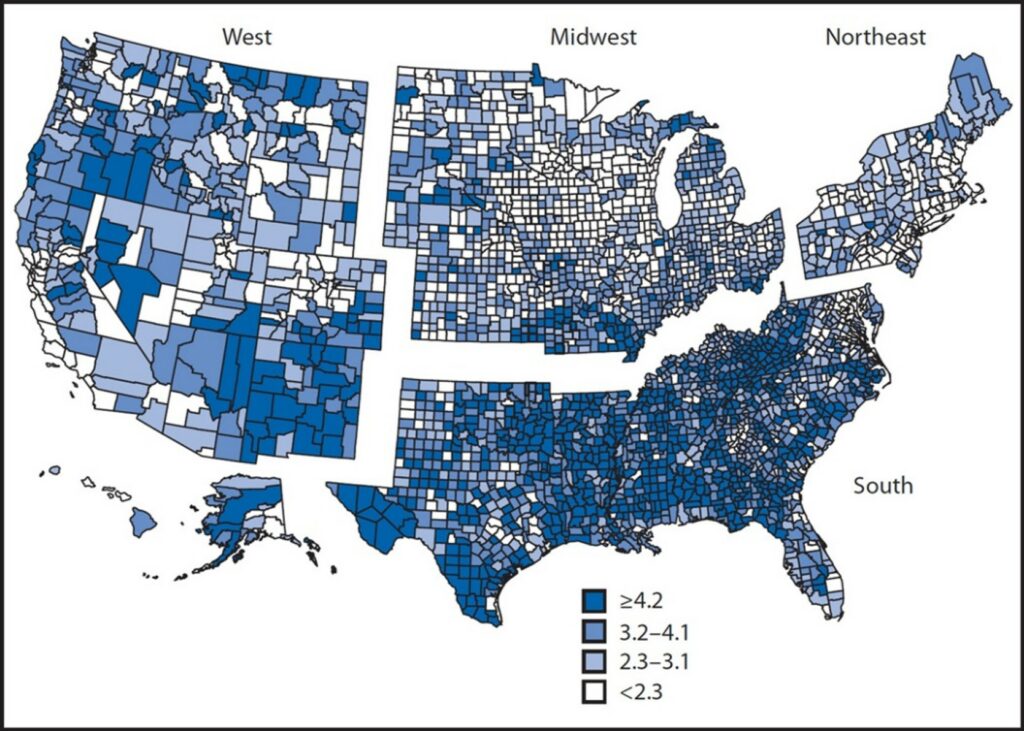
 Percentages of persons aged ≥18 years with severe vision loss, by county—United States,
American Community Survey, 2009–2013
Editor’s note: This post is the last in our series for Older Americans Month. It represents a call to action to increase the availability of vision rehabilitation services for older people in this country.
For years, the vision rehabilitation field has been talking about the tsunami of older people with vision loss coming our way. Given the number of older people in this country and its expected growth, it is no surprise that the prevalence of age-related vision loss would also dramatically increase. Now thanks to a major project undertaken by the VisionServe Alliance Aging and Vision Loss National Coalition (AVLNC), we have data by state and county to back up our prognostications.
What Does the Big Data Set Include?
This data includes gender, race and ethnicity, income, education levels, quality of life indicators, and chronic conditions. These are all important factors for planning service delivery approaches on a national, state, and county level basis, including social determinants of health factors that public health, service providers, and funders use to plan, target, and fund services.
As discussed in last year’s APH VisionAware Big Data article, “According to the national report (covering all 50 states), 7.3% of elderly individuals report blindness or vision loss. (Crews & VanNasdale, 2022).” States and counties vary in prevalence. For example, in my state of Tennessee, we know that over 9% of people 65 and older have vision problems; some counties have 20% or more, while a few have as low as 2.3%. The data indicates the pattern is true in other states, such as Louisiana, with a statewide prevalence rate of 12.4% and parish prevalence rates ranging from 3.5 to 17.5%. To further demonstrate the variance of prevalence around the country: California ranges from 11%-2.15; Florida, 13.2%-3.7%; Missouri, 21.1%-2.6%; and New York, 15.4%-3%.
Some of the findings include that, as a whole, older people with vision loss are more likely to have lower incomes, lower education levels, have a less health-related quality of life, have chronic conditions such as diabetes, heart disease, and hearing loss, and have more problems with walking or climbing stairs, bathing, or dressing, and running errands. Additionally, in the US, the prevalence rate among older White individuals is 6.1%; Black individuals, 10.5%; American Indians, 14.2%; and Hispanic individuals, 13.9%. On the state level, older people who are Black, Indigenous, and People of Color consistently have a higher prevalence of vision loss than White people. (VisionServe Alliance 2022, United States’ Older Population and Vision Loss: A Briefing, St Louis.)
How is Big Data Being Used
In Tennessee, we are working on including the Big Data stats in the Multisector Plan on Aging, which includes the following goals: health and health care, caregiving, community choice, employment, and security and protection. These are lofty goals, but the devil is in the details. It is incumbent on advocates to ensure that the needs of older individuals with vision loss are represented as the plan goes forward. Having and sharing Big Data information and its implications is crucial.
Texas has used the data to set up training centers in populated areas through existing agencies and advocate for additional service delivery funding. New York’s Big Data Report is helping frame issues and critical needs to advocate for more state funding to serve the older blind population. The Big Data Report has been shared with the New York State Office of the Governor, the New York State Commission for the Blind, the New York State Chief Disability Officer, the New York State Department of Health, the New York City Department for the Aging, and advocates are collaborating with a Senator’s office to including vision and vision rehabilitation in the Older Americans Act.
As you can see, there are many uses for the data and much work that needs to be done to continue to advocate.
Interested in the Data for Your State?
Check out the AVLNC Big Data reports to date.
Did you find your state? If not, what’s next?
What Remains to be Done?
Unfortunately, not all states have been completed due to lack of funding. Each report costs $10,000 to complete. VisionServe welcomes your help in finding funders for the remaining states, which are as follows:
Alaska
Arizona
Arkansas
Connecticut
Delaware
District of Columbia
Hawaii
Idaho
Indiana
Iowa
Maine
Maryland
Minnesota
Mississippi
Montana
Nevada
New Hampshire
New Mexico
North Dakota
Rhode Island
South Dakota
Utah
Vermont
West Virginia
Wyoming
Also, AVLNC welcomes your involvement in our coalition. Contact Libby Murphy at [email protected] or (318) 401-3350 to find out more.